


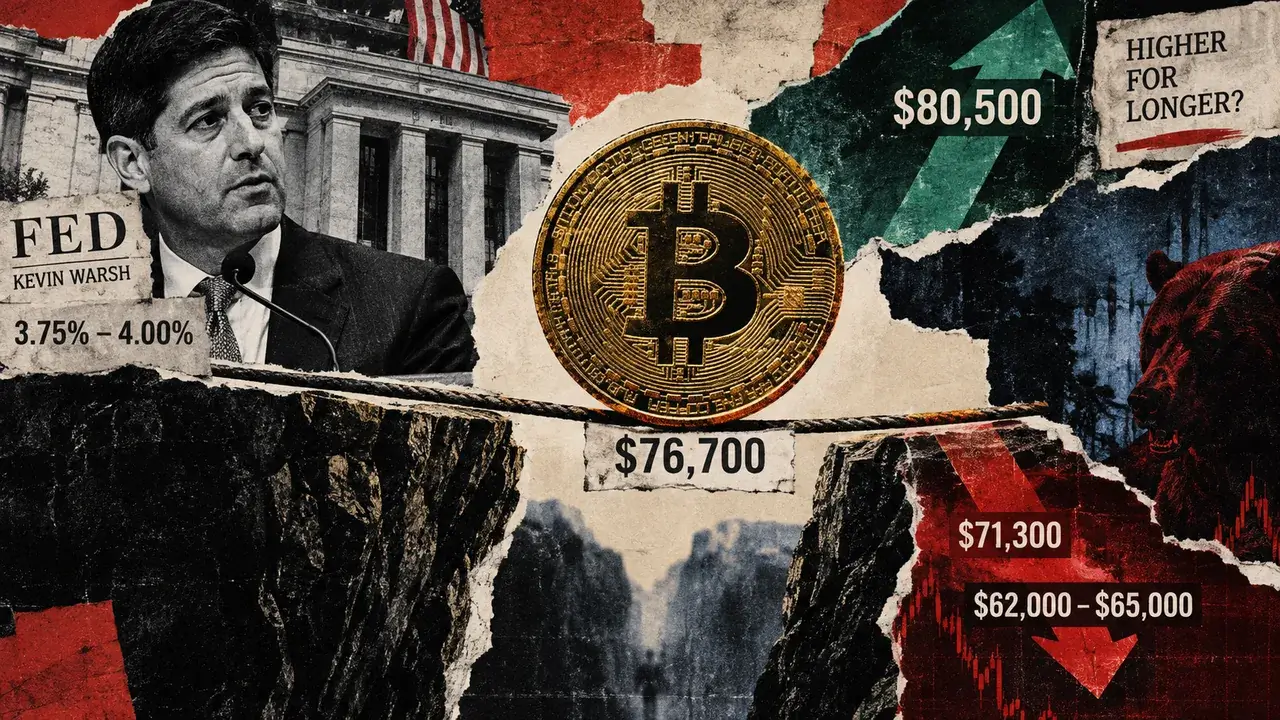
Bitcoin fell to an intraday low of $75,064.82 on Sept. 16, but recovered and reclaimed the $76,000 zone after Fed Chair Kevin Warsh’s press conference wrapped up.
The S&P 500 fell roughly 0.7%, the Dow dropped 1.2%, and the 2-year Treasury yield climbed to 4.734% in the same window, while Bitcoin held its ground.
Warsh’s real signal sat well past the hike itself
The Fed raised its target range 25 basis points to 3.75% to 4.00% in a unanimous 12-0 vote, but fixed-income derivatives had already priced in odds above 90% of that move before the meeting began.
Warsh then said at his press conference that he would be “hard pressed” to call broad financial conditions restrictive. A dot plot released alongside the decision showed 16 of 18 policymakers projecting at least one more hike this year.
That combination raises the bar for every liquidity-sensitive asset well beyond what a single quarter-point move could settle on its own.
| Asset / indicator | Sept. 16 reaction | Why it matters for Bitcoin |
|---|---|---|
| Bitcoin | Fell to $75,064.82, then reclaimed $76,000 | Showed short-term resilience despite macro pressure |
| S&P 500 | Down roughly 0.7% | Risk assets gave back ground after the press conference |
| Dow Jones | Down roughly 1.2% | Clearest equity-market selloff signal |
| 2-year Treasury yield | Rose to 4.734% | Higher front-end yields raise the hurdle for liquidity-sensitive assets |
| Fed target range | 3.75%–4.00% | Confirms tighter policy backdrop |
| Policymakers seeing another hike | 16 of 18 | Shows the issue is the forward rate path, not just one hike |
Markus Levin, co-founder of XYO, argued the hike itself was never the number worth watching.
In a note to CryptoSlate, he said:
“Rates are likely to stay restrictive for longer than investors had hoped.”
Levin pointed to the median year-end rate near 4% to 4.25%, and also said that he is watching Treasury yields and liquidity conditions more closely than the Fed’s headline decision, since Bitcoin has already absorbed much of the higher-rate expectation built into this meeting.
He said that if yields stabilize, the asset can continue to trade on institutional demand and improving liquidity, while adding that a run of additional priced-in hikes would weigh on risk assets broadly.
Four demand gauges have all turned in the same direction for Bitcoin
Glassnode’s latest on-chain report shows Bitcoin trading just below its $76,700 True Market Mean, the average price paid by active investors, and every major demand channel weakening at once.
Realized Cap posted its first negative daily reading, breaking a 27-day growth run. US spot Bitcoin ETFs recorded $450.4 million of net outflows on Sept. 15, led by $214.8 million out of FBTC and $161.7 million out of IBIT.
Stablecoin supply sits near $301 billion, flat for the week and roughly 4% below its April peak. Corporate treasury purchases have slowed to just 5,900 BTC over the past three months, a fraction of the 89,000 BTC bought in July 2025 alone.
| Demand gauge | Latest reading | Signal |
|---|---|---|
| Realized Cap | First negative daily reading after 27 days of growth | Capital inflows have stalled |
| Spot Bitcoin ETFs | $450.4M net outflow on Sept. 15 | Institutional demand turned negative |
| Stablecoin supply | Around $301B, flat weekly | Crypto-native liquidity is not expanding |
| Corporate BTC purchases | 5,900 BTC over three months | Treasury demand has slowed sharply |
| Corporate treasury cost basis | $80,500 | Now sits overhead as resistance |
That leaves those buyers’ $80,500 average cost basis sitting overhead now as resistance.
Fabian Dori, chief investment officer at Sygnum Bank, framed that slowdown as a structural liquidity question that outlasts any single Fed meeting.
He said:
“Treasury cash balances, private credit creation and stablecoin supply set conditions on a longer clock than any single meeting.”
In his view, the more relevant question is whether those broader liquidity channels tighten alongside monetary policy itself.
The $76,700 line decides which story is true
Glassnode’s criteria require daily closes to settle the question, well beyond any single intraday print.
A second daily close below $76,700 would confirm a genuine range break, opening a path toward $71,300, the short-term holder cost basis, and potentially the $62,000 to $65,000 zone where this year’s deeper accumulation took place.
Two daily closes back above $76,700, paired with renewed Realized Cap growth, would restore the prior range and put the $80,500 corporate cost basis back in play as the next test higher.
Martin Lee, market insights lead at DWF Labs, sees the immediate danger sitting just below the current price. Lee said that the vulnerable longs sit between $75,000 and $76,000, warning that a sustained hawkish stance would force risk-on assets to reprice around a higher-for-longer reality well past the idea of a single completed hike.
Lewis Huang, an analyst at Bitget, noted that Bitcoin has historically absorbed roughly four times the S&P 500’s move on major rate-driven days. Core annual inflation hit a five-year low Sept. 11, with the headline number driven almost entirely by gasoline prices up 3.9% in a month and diesel up more than 60% on the year.
Huang said that those pressures can reverse faster than underlying inflation, adding that there is a real risk that the Fed keeps tightening well past the point where the energy shock that justified it has already faded.
Bitcoin resilience could turn into accumulation or delayed distribution
The bull case has Bitcoin closing back above $76,700 on consecutive days, with Realized Cap growth resuming and ETF inflows returning now that the Fed decision sits in the past.
Matt Mena, senior crypto research strategist at 21Shares, placed his $100,000 year-end target inside exactly that scenario. He pointed to more than $3 billion in Bitcoin ETF inflows over the past two months, and to Bitcoin’s history of finding a floor near current levels before reaching fresh highs, as it did once last April’s tariff selloff passed.
| Scenario | Confirmation trigger | Next level to watch | Article interpretation |
|---|---|---|---|
| Bull case | Two daily closes above $76,700 plus renewed Realized Cap growth | $80,500, then $83K–$86K | Resilience turns into accumulation |
| Neutral case | BTC holds between $75K–$76.7K without fresh inflows | $76,700 | Market remains unresolved |
| Bear case | Second daily close below $76,700 with ETF redemptions continuing | $71,300 | Calm gets reread as weak demand |
| Deeper breakdown | $71,300 fails and liquidity thins below $68K | $62K–$65K | Accumulation floor becomes the next test |
| Bull target | Demand returns after the Fed decision | $100,000 | 21Shares’ year-end case stays alive |
That target depends entirely on demand data turning, beyond the fact that the hike now sits behind the market.
The bear case has a second daily close below $76,700 arriving alongside continued ETF redemptions and stablecoin supply that stays flat without any real growth.
Under that path, Bitcoin’s calm this week gets reread as quiet distribution well short of genuine strength. A break of the $71,300 short-term-holder floor would expose thinning order-book liquidity that Glassnode shows is largely evaporating below $68,000, leaving the deeper $62,000 to $65,000 accumulation zone as the next real test.
Bitcoin passed its first test simply by not falling with everything else this week. Whether that counts as strength depends entirely on numbers that will not be visible until fresh capital either shows up or continues to stay away.
